Essay
Business School Graduates
A sample of business school graduates were asked what their major was.The results are shown in the following frequency distribution.

-{Business School Graduates Narrative} If you were only given the frequency bar chart below, would you able to reconstruct the original observations in the data set? 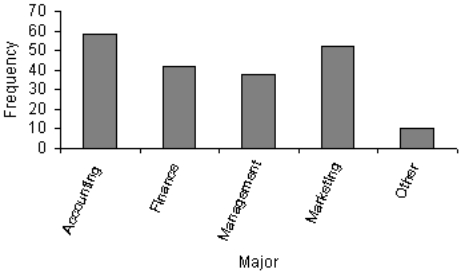
Correct Answer:

Verified
No; you cannot reconstruct the original ...View Answer
Unlock this answer now
Get Access to more Verified Answers free of charge
Correct Answer:
Verified
View Answer
Unlock this answer now
Get Access to more Verified Answers free of charge
Q4: Which of the following situations is best
Q12: A category in a pie chart that
Q13: A pie chart is used to represent
Q22: A frequency distribution lists the categories and
Q35: At the end of a safari,the tour
Q43: Twenty-five voters participating in a recent election
Q46: A(n)_ distribution lists the categories of a
Q50: Your gender is a nominal variable.
Q59: A college professor classifies his students according
Q78: Nominal data are also called qualitative or