Multiple Choice
Which of the following graphs most likely describes the effect of pH on the function of the enzyme catalase in human cells? Note: The x-axis is pH and the y-axis is enzyme activity.
A) 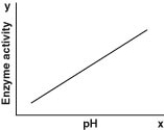
B) 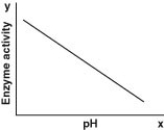
C) 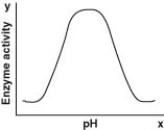
D) 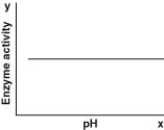
Correct Answer:

Verified
Correct Answer:
Verified
Related Questions
Q9: How might a change of one amino
Q10: Chemical equilibrium is relatively rare in living
Q11: Which of the following statements describes a
Q12: Which of the following statements is true
Q13: Which of the following aspects of enzyme
Q15: Why do hydrolysis reactions occur more readily
Q16: Which of the following statements about anabolic
Q17: HIV is the virus that causes AIDS.
Q18: Which of the following statements about enzyme
Q19: A number of systems for pumping ions