Multiple Choice
Figure 4A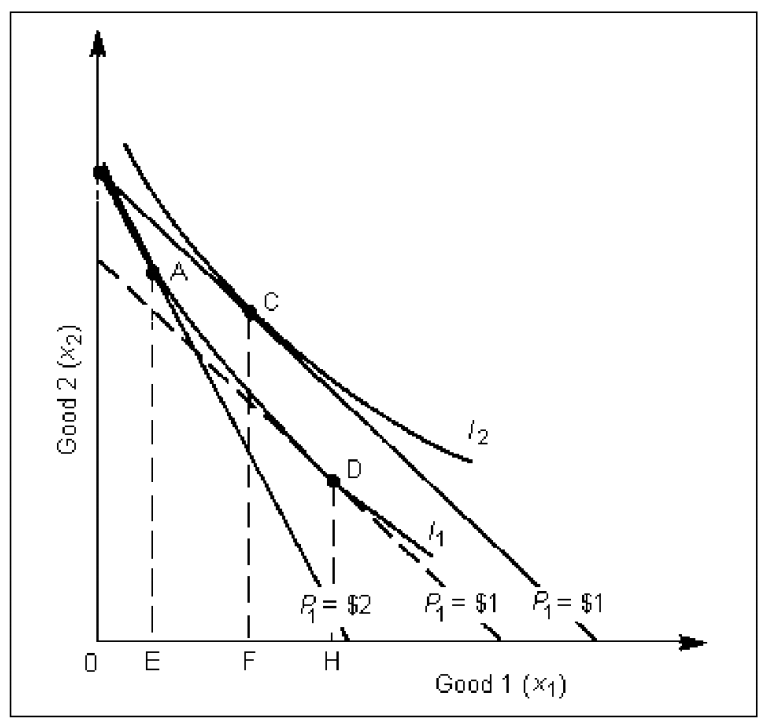
-The indifference map in Figure 4A illustrates the effect of a:
A) price decrease in x1.
B) price increase in x2.
C) change in the consumer's income.
D) price decrease in x2.
Correct Answer:

Verified
Correct Answer:
Verified
Related Questions
Q2: If a good is neither normal nor
Q3: Better apples tend to get shipped out
Q4: The water diamond paradox illustrates that:<br>A)diamonds are
Q5: For an inferior good:<br>A)the income effect is
Q6: For normal goods the substitution effect is:<br>A)unrelated
Q8: Joe's utility function is given by U(x,y)=
Q9: If the Laspeyres quantity index is less
Q10: Giffen goods are goods for which the
Q11: If a good is neither normal nor
Q12: If a good is normal, then:<br>A)the income