Multiple Choice
Figure 2A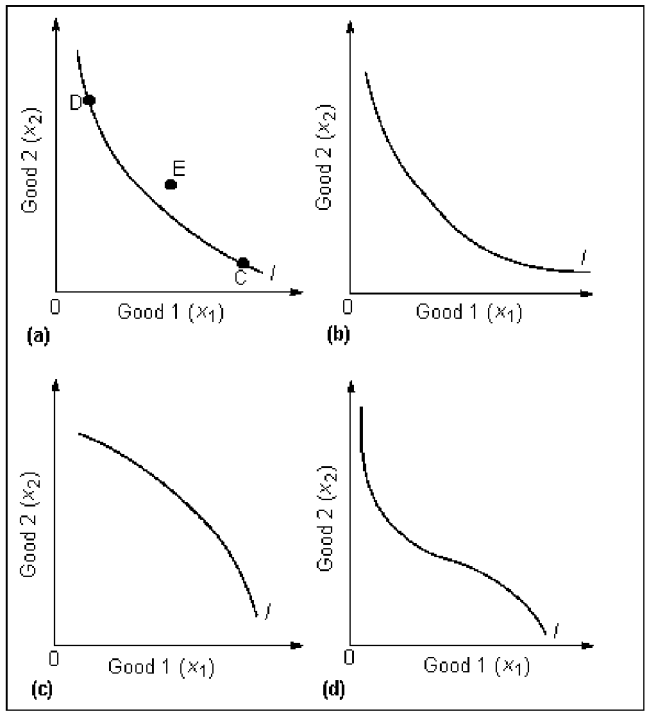
-In Figure 2A, the utility function for some individual is U(x1,x2) =x1x2. An indifference curve for this individual is depicted in:
A) Figure 2A (a) .
B) Figure 2A (b) .
C) Figure 2A (c) .
D) Figure 2A (d) .
Correct Answer:

Verified
Correct Answer:
Verified
Q1: Indifference curves provide a way to graphically
Q2: Which of the following are necessary assumptions
Q4: One of the factors influencing the increase
Q5: Utility numbers provide:<br>A)positive information to society.<br>B)precise differences
Q6: If an individual turns down more spinach
Q7: In economics, consumption bundles are:<br>A)utility functions.<br>B)bags used
Q8: Carl has the utility function U(x,y)= 2xy.
Q9: Overtime pay is higher than regular pay
Q10: Assume that when you get home today,
Q11: Tom currently has 100 units of x<sub>1</sub><sub>