Multiple Choice
The question refers to the following table, which compares the percent sequence homology of four different parts (two introns and two exons) of a gene that is found in five different eukaryotic species. Each part is numbered to indicate its distance from the promoter (for example, Intron I is the one closest to the promoter) . The data reported for species A were obtained by comparing DNA from one member of species A to another member of species A.
% Sequence Homology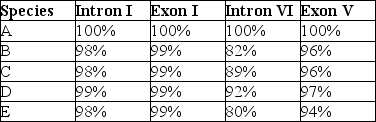
Based on the tabular data, and assuming that time advances vertically, which phylogenetic tree is the most likely depiction of the evolutionary relationships among these five species?
A) 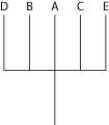
B) 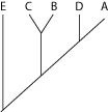
C) 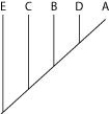
D) 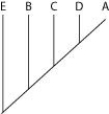
Correct Answer:

Verified
Correct Answer:
Verified
Q25: What kind of evidence has recently made
Q54: Use the figure to answer the following
Q55: Use the figure to answer the following
Q56: <img src="https://d2lvgg3v3hfg70.cloudfront.net/TB1096/.jpg" alt=" In Figure 26.4,
Q57: Use the following information to answer the
Q58: The legless condition that is observed in
Q61: Which of the following statements is accurate
Q62: Imagine that you discovered the following information:<br><img
Q63: Use the following figure and description to
Q64: Molecular clocks are more reliable when _.<br>A)