Multiple Choice
The following question refers to the figure.
In this eight-year experiment, 12 populations of E. coli, each begun from a single cell, were grown in low-glucose conditions for 20,000 generations. Each culture was introduced to fresh growth medium every 24 hours. Occasionally, samples were removed from the populations, and their fitness in low-glucose conditions was tested against that of members sampled from the ancestral (common ancestor) E. coli population.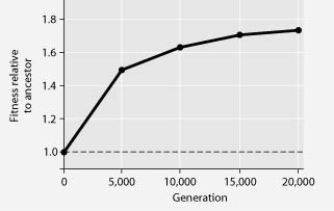
Imagine that after generation 20,000, the experimental cells were grown in high-glucose conditions for 20,000 generations (using the same transfer process described) . Refer to the y-axis on the graph and predict the fitness of the new lines when tested in low- and high-glucose conditions.
A) low: 1.0; high: 1.0
B) low: 1.6; high: 1.6
C) low: 1.0; high: 1.6
D) low: 1.6; high: 1.0
Correct Answer:

Verified
Correct Answer:
Verified
Q7: The predatory bacterium Bdellovibrio bacteriophorus drills into
Q8: The following question refers to the figure.<br>In
Q9: A hypothetical bacterium swims among human intestinal
Q10: Data were collected from the heterocysts of
Q11: The following table depicts characteristics of five
Q13: If all prokaryotes on Earth suddenly vanished,
Q14: Biologists sometimes divide living organisms into two
Q15: The following table depicts characteristics of five
Q16: Use the following information and graph to
Q17: Use the information in the following paragraph