Multiple Choice
Use the following to answer questions
This figure represents the distribution of the percent of state residents living in a metropolitan area for all 50 U.S.states and Washington D.C. 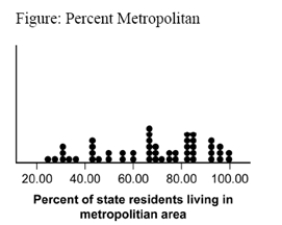
-(Figure: Percent Metropolitan) The plot in the figure is a:
A) histogram.
B) stem-and-leaf plot.
C) dot plot.
D) box plot.
Correct Answer:

Verified
Correct Answer:
Verified
Q104: A researcher is comparing two groups.The population
Q105: The formula for the degrees of freedom
Q106: Which report of statistical results is in
Q107: Two types of graphs that make it
Q108: A dot plot allows us to _,
Q110: The standard deviation of the sample is
Q111: Degrees of freedom for the single-sample t
Q112: Why does one divide by N -
Q113: The second step in conducting the single-sample
Q114: The correct formula for the upper bound