Multiple Choice
Use the following to answer questions
This figure represents the distribution of the percent of state residents living in a metropolitan area for all 50 U.S.states and Washington D.C. 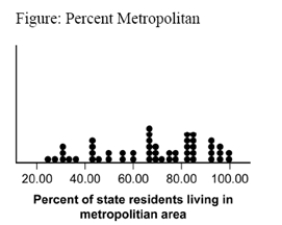
-(Figure: Percent Metropolitan) The figure indicates that:
A) most states have greater than 60 percent of their population living in metropolitan areas.
B) on average, 60 percent of all states' populations live in a metropolitan area.
C) the population of most states is concentrated in rural areas.
D) few states have larger urban centers.
Correct Answer:

Verified
Correct Answer:
Verified
Q50: As degrees of freedom decrease, the critical
Q51: As degrees of freedom increase, the critical
Q52: With very few degrees of freedom, the
Q53: The first step in creating a dot
Q54: Critical t values _ as the degrees
Q56: What is one benefit of increasing the
Q57: When computing the confidence interval for a
Q58: The _ indicates the distance of a
Q59: Based on the statistical results provided, which
Q60: The correct formula for effect size