Multiple Choice
Use the following to answer questions
This figure depicts the results of a study by Ahluwalia et al.(2006) investigating the effects of two types of gum (placebo or nicotine) and two types of counseling (educational or motivational) in helping people to stop smoking.
Figure: Smoking Cessation 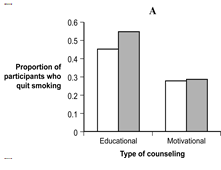
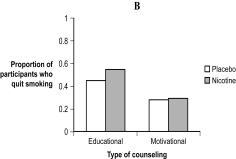
-(Figure: Smoking Cessation) What is the difference between the data depicted in Figure A and the data in Figure B?
A) Figure A does not graph the same independent variables as Figure B.
B) Figure A does not graph the same dependent variable as Figure B.
C) The bars in Figure A are more accurate than those in Figure B.
D) The y-axis in Figure A has been shortened, which exaggerates the differences between the groups.
Correct Answer:

Verified
Correct Answer:
Verified
Q78: Use the following to answer questions <br>This
Q79: Use the following to answer questions <br>Figure:
Q80: In a _ images are used at
Q81: The size of each slice in a
Q82: To efficiently conduct an alumni survey, a
Q84: Use the following to answer questions <br>This
Q85: Data based on a biased scale typically
Q86: Line graphs are used to represent the
Q87: The y-axis of a bar graph indicates
Q88: A _ depicts the relation between two