Multiple Choice
Use the following to answer questions
This figure depicts the results of a study by Ahluwalia et al.(2006) investigating the effects of two types of gum (placebo or nicotine) and two types of counseling (educational or motivational) in helping people to stop smoking.
Figure: Smoking Cessation 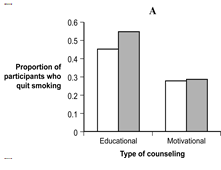
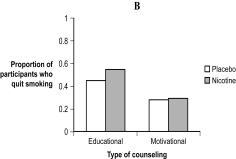
-(Figure: Smoking Cessation) Which Figure, A or B, would be the best figure to use when presenting the results of this study and why?
A) Either graph would be perfectly acceptable for presenting the results of the study.
B) Figure A would be the best because it depicts the tallest bars.
C) Figure B would be the best because the y-axis depicts the actual possible values on the dependent measure.
D) Neither graph would be acceptable when presenting the results of the study.
Correct Answer:

Verified
Correct Answer:
Verified
Q28: On a histogram the x-axis depicts the
Q29: Use the following to answer questions <br>Figure:
Q30: Popular magazines and Internet sources often use
Q31: An inaccurate values lie tells the truth
Q32: Which of these would be appropriate to
Q34: _ are an efficient way to visually
Q35: Use the following to answer questions <br>Figure:
Q36: When creating a bar graph, the pattern
Q37: A type of line graph used to
Q38: Scatterplots are often used to assess what