Multiple Choice
Use the following to answer questions
This figure depicts the typical relation found between a person's age (in years) and his or her reaction time in a simple reaction time task (e.g., time to press a button when a light turns green) .
Figure: Age and Reaction Time 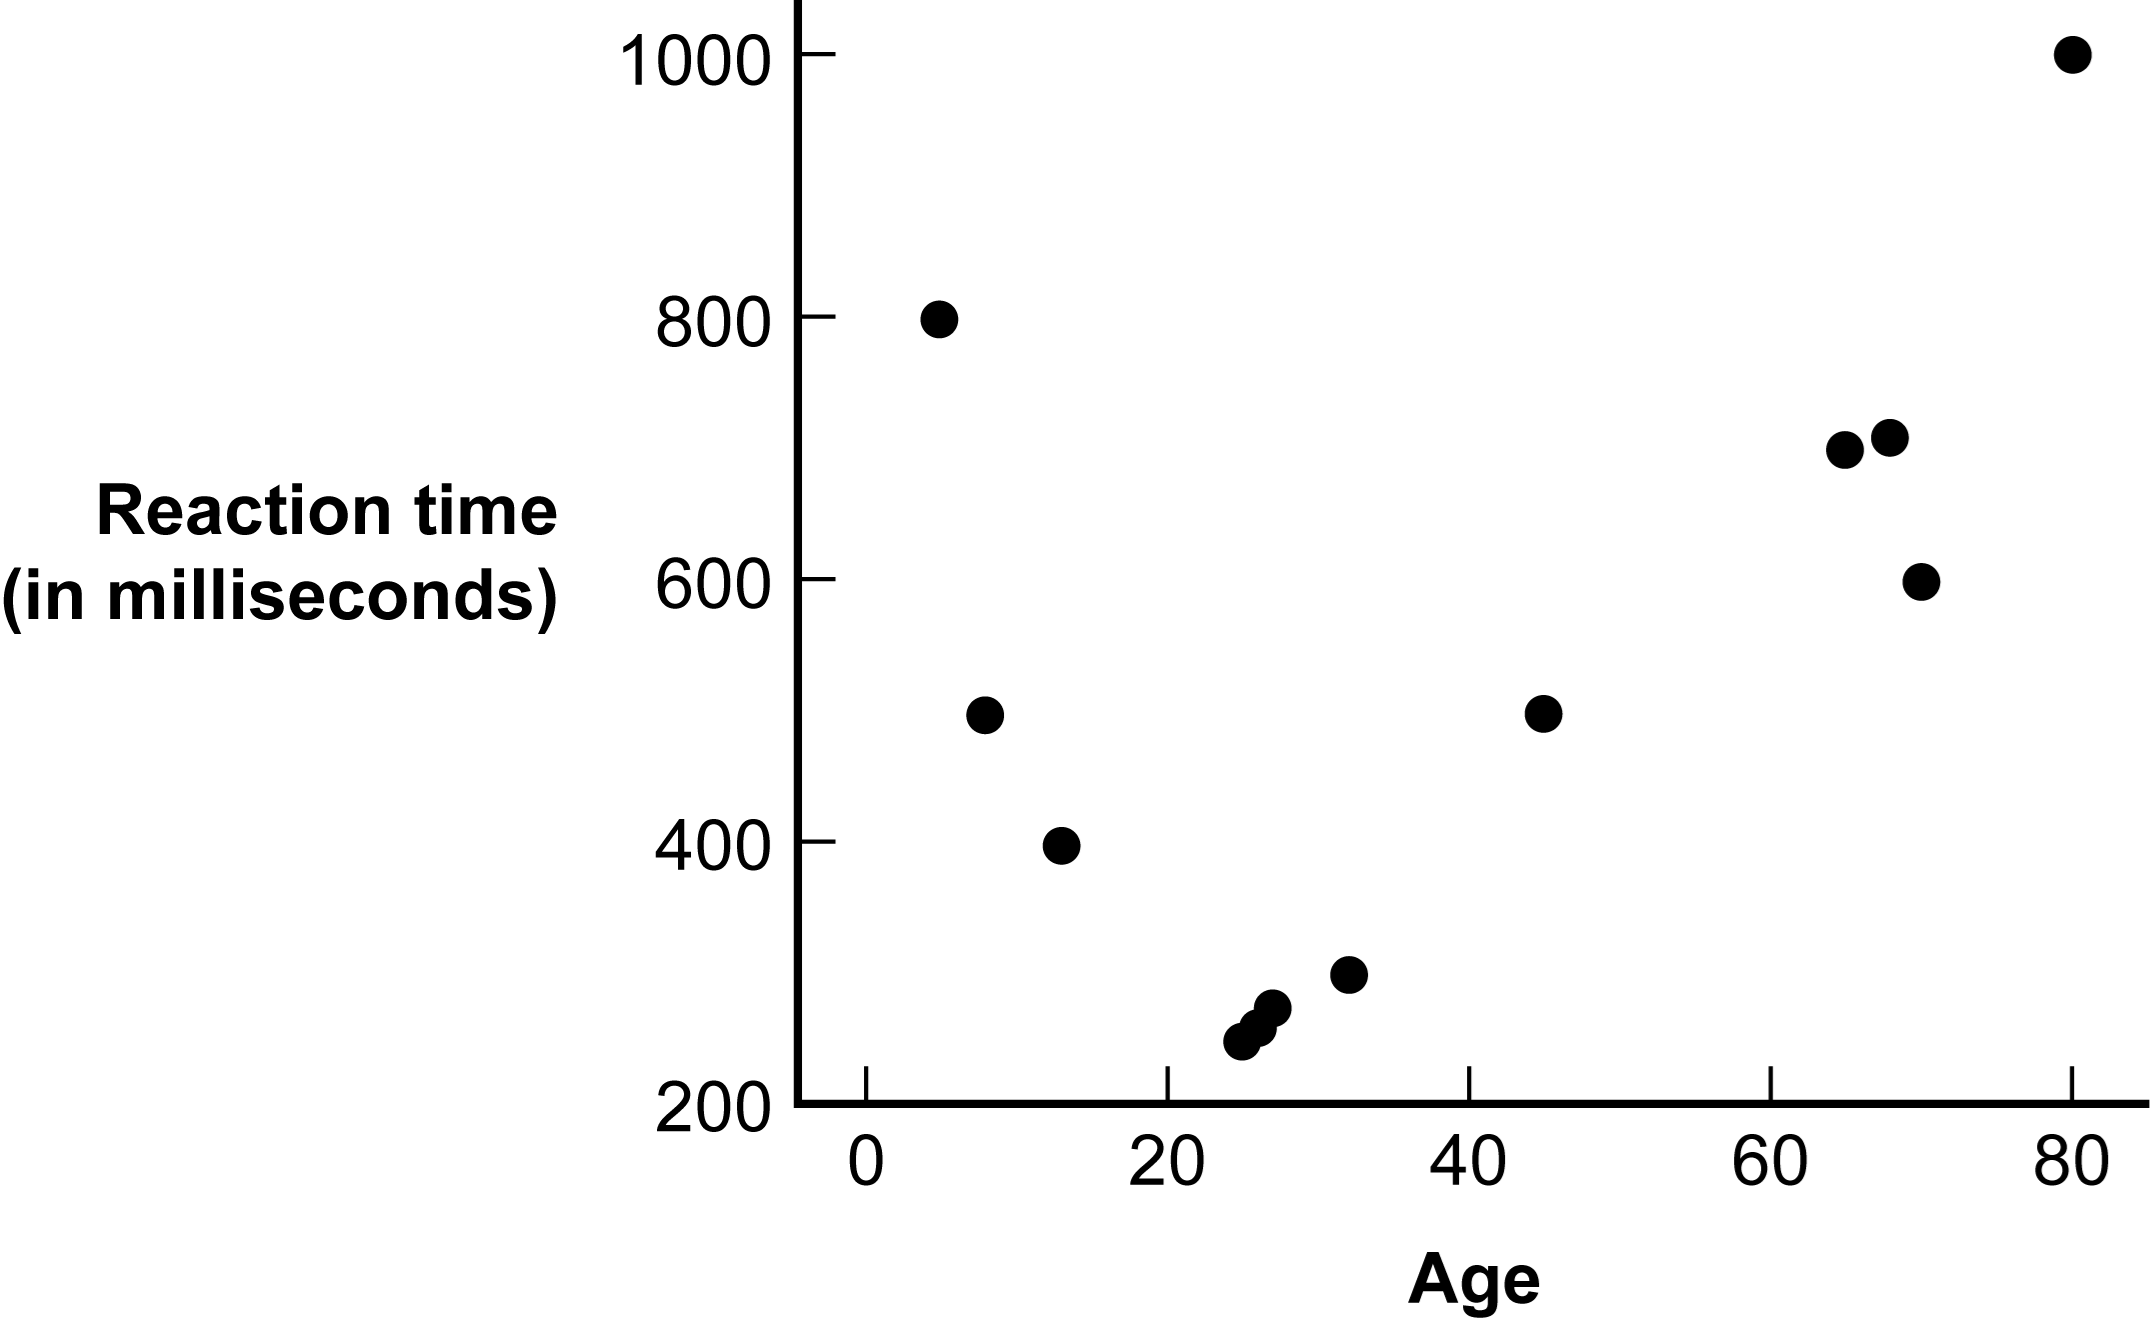
-(Figure: Age and Reaction Time) Based on the graph, what type of relation exists between age and reaction time?
A) linear
B) nonlinear
C) It is not possible to tell, given the information in the graph.
D) There is no relation between age and reaction time.
Correct Answer:

Verified
Correct Answer:
Verified
Q45: In the _ lie participants in a
Q46: A graph that depicts the relation between
Q47: If graphing one scale independent variable and
Q48: Any background pattern on which graphs appear
Q49: A scatterplot with a line of best
Q51: The first step in creating a scatterplot
Q52: Use the following to answer questions <br>Figure:
Q53: If graphing one nominal independent variable and
Q54: When constructing a graph, it is better
Q55: What is a potential benefit of creating