Multiple Choice
Use the following to answer questions
This figure depicts the typical relation found between a person's age (in years) and his or her reaction time in a simple reaction time task (e.g., time to press a button when a light turns green) .
Figure: Age and Reaction Time 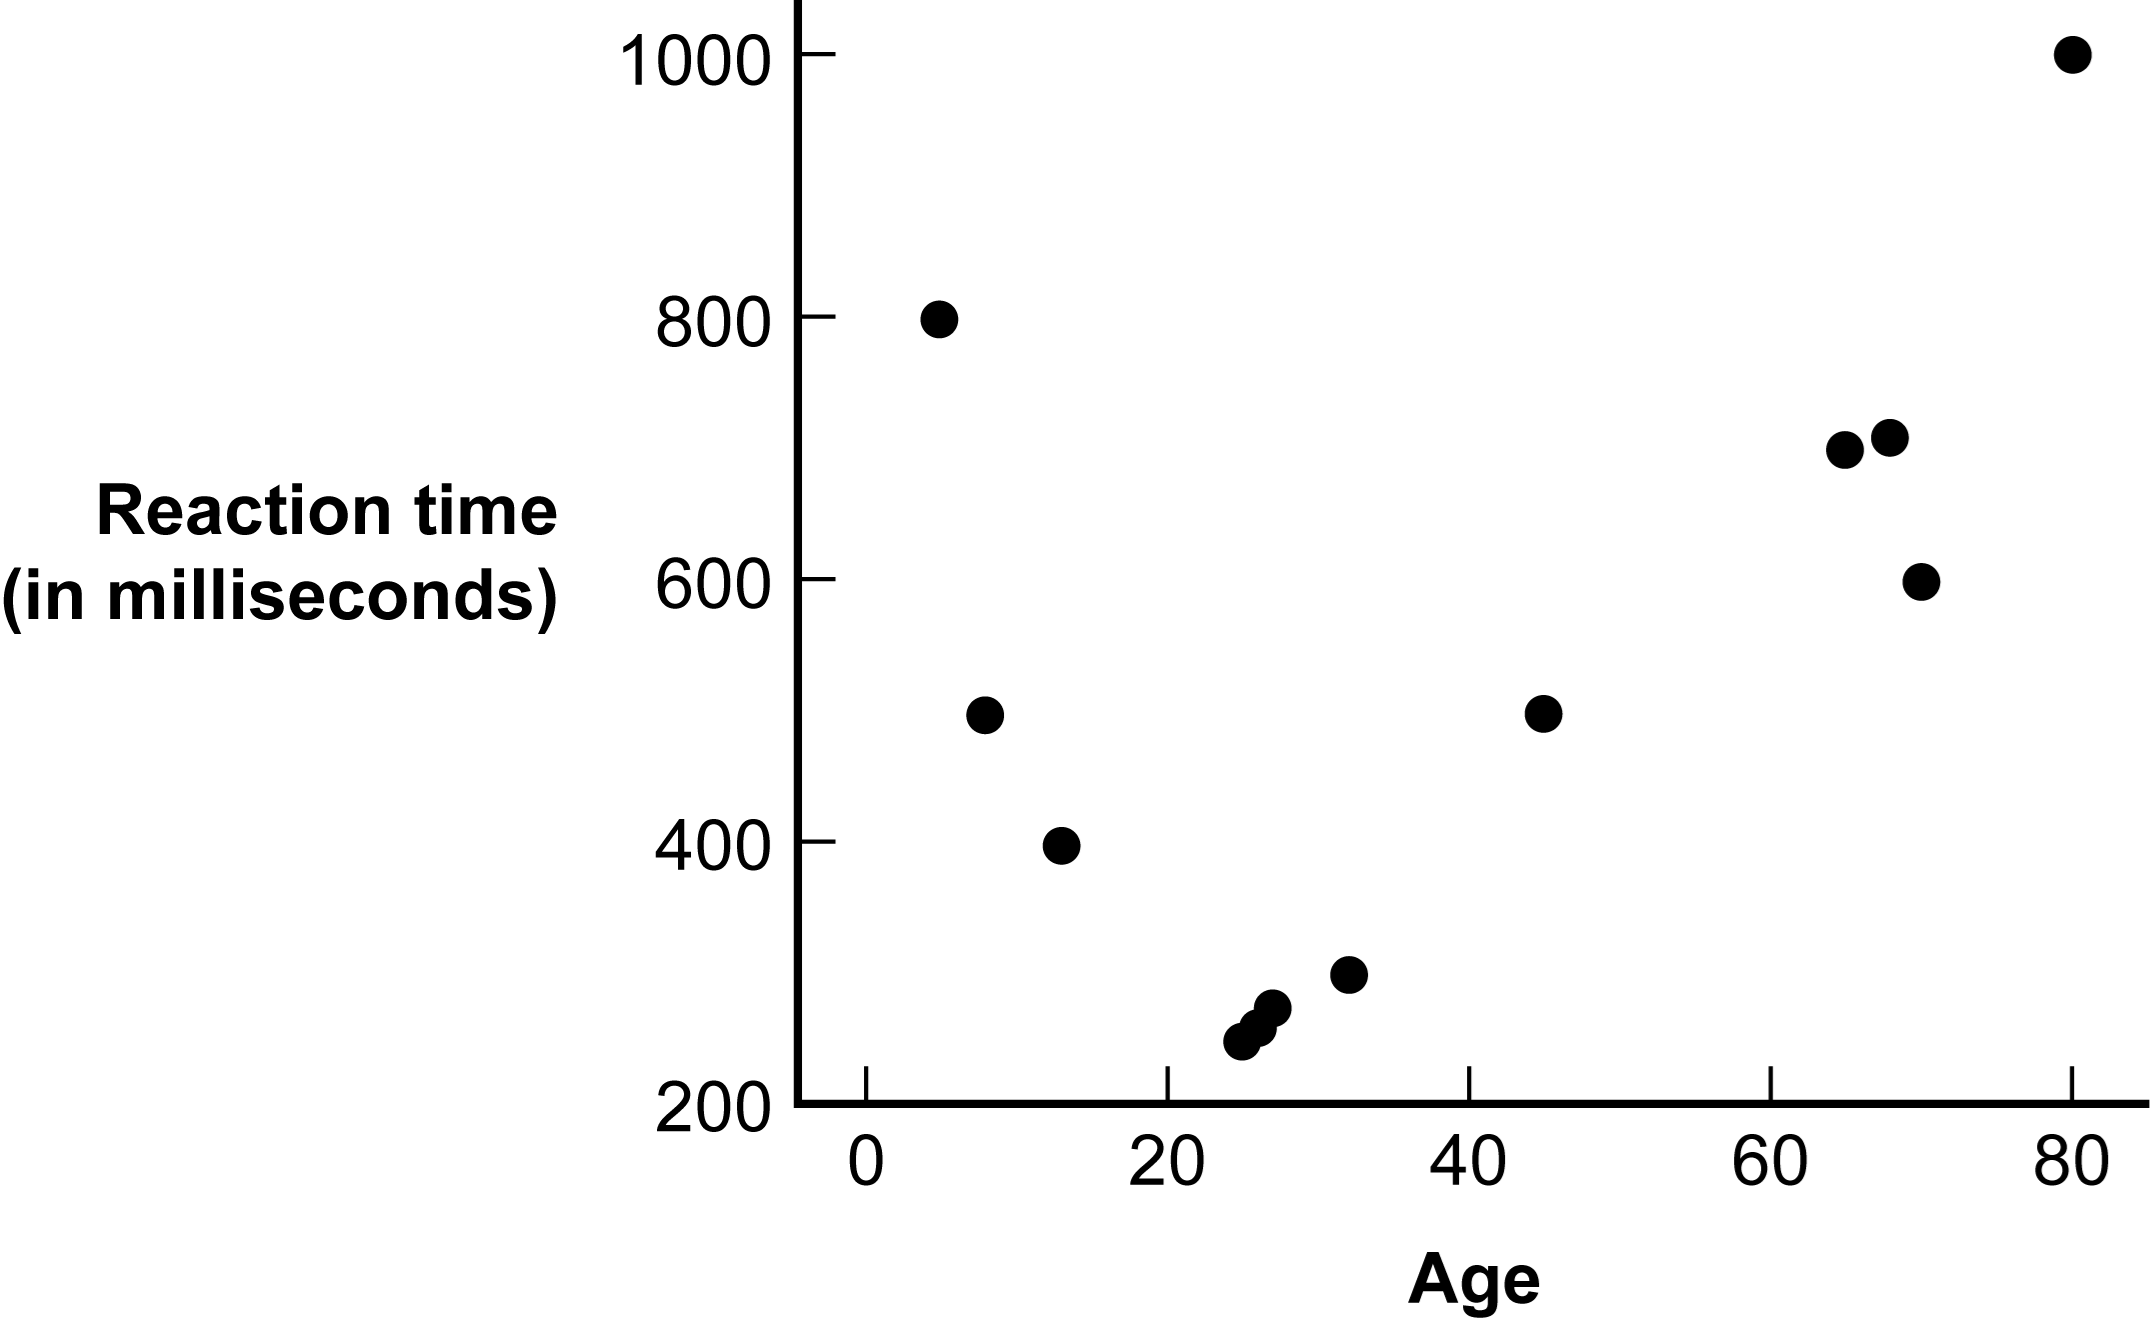
-(Figure: Age and Reaction Time) Which statement best captures what the graph depicts?
A) Reaction time decreases throughout childhood and adolescence, becoming fastest in a person's early 20s, but after that point, reaction time slowly increases as a person continues to age.
B) There is a linear relation between age and reaction time such that reaction time increases with increased age.
C) Reaction time increases throughout childhood and adolescence, becoming slowest in a person's early 20s, but after that point, reaction time slowly decreases as a person continues to age.
D) There is no relation between age and reaction time.
Correct Answer:

Verified
Correct Answer:
Verified
Q18: Graphs based on sneaky samples are representative
Q19: It is always best to use the
Q20: Viri wants to graph the number of
Q21: If two variables are not related linearly,
Q22: A private high school wants to show
Q24: The cutesy images used to represent data
Q25: Tori wants to graph the relation between
Q26: Bar graphs are highly informative, but they
Q27: Why are pictorial graphs typically used only
Q28: On a histogram the x-axis depicts the