Multiple Choice
Use the following to answer questions
This graph depicts fictional data that replicate the pattern of performance observed in a study published by Nietfeld and Ender (2003) .
Figure: Intelligence and Teaching Efficacy 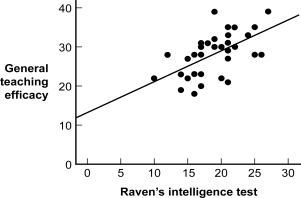
-(Figure: Intelligence and Teaching Efficacy) What might be one way of improving the readability of the graph?
A) Add some ducks to the graph.
B) Trim the range represented on both axes so that it depicts only values in the actual data set.
C) Use a computer program to put gridlines on the background of the graph.
D) Expand the range represented on both axes so that it depicts values beyond the actual data set for grounding.
Correct Answer:

Verified
Correct Answer:
Verified
Q10: Multivariable graphs allow for the simultaneous depiction
Q11: A group of students graphs the number
Q12: _ allow one to connect points on
Q13: Scatterplots are often used to assess what
Q14: A researcher labels the dependent variable of
Q16: A graph showing new job growth by
Q17: The background images or patterns often included
Q18: Graphs based on sneaky samples are representative
Q19: It is always best to use the
Q20: Viri wants to graph the number of