Multiple Choice
Use the following to answer questions
This graph depicts fictional data that replicate the pattern of performance observed in a study published by Nietfeld and Ender (2003) .
Figure: Intelligence and Teaching Efficacy 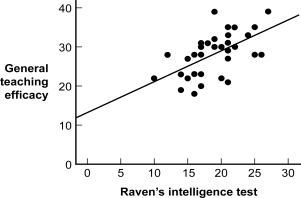
-(Figure: Intelligence and Teaching Efficacy) The type of graph depicted in the figure is a:
A) nonlinear relation plot.
B) Pareto chart modified to dot form.
C) scatterplot with a line of best fit.
D) histogram.
Correct Answer:

Verified
Correct Answer:
Verified
Q96: The lie of interpolation assumes that a
Q97: A bubble graph is one that:<br>A) is
Q98: When the data on a scatterplot form
Q99: A duck is a type of chartjunk
Q100: Sun is reading an article about autism
Q102: A researcher finds that first-year college students
Q103: At major research institutions, the intense pressure
Q104: The interpolation lie can involve:<br>A) using a
Q105: What is a Pareto chart?<br>A) a bar
Q106: _ refer(s) to any unnecessary information in