Multiple Choice
Use the following to answer question
This figure depicts gas prices for the month of August from 1976 to 2004.(Data were extracted from the Bureau of Labor Statistics Web site.)
Figure: Gas Prices 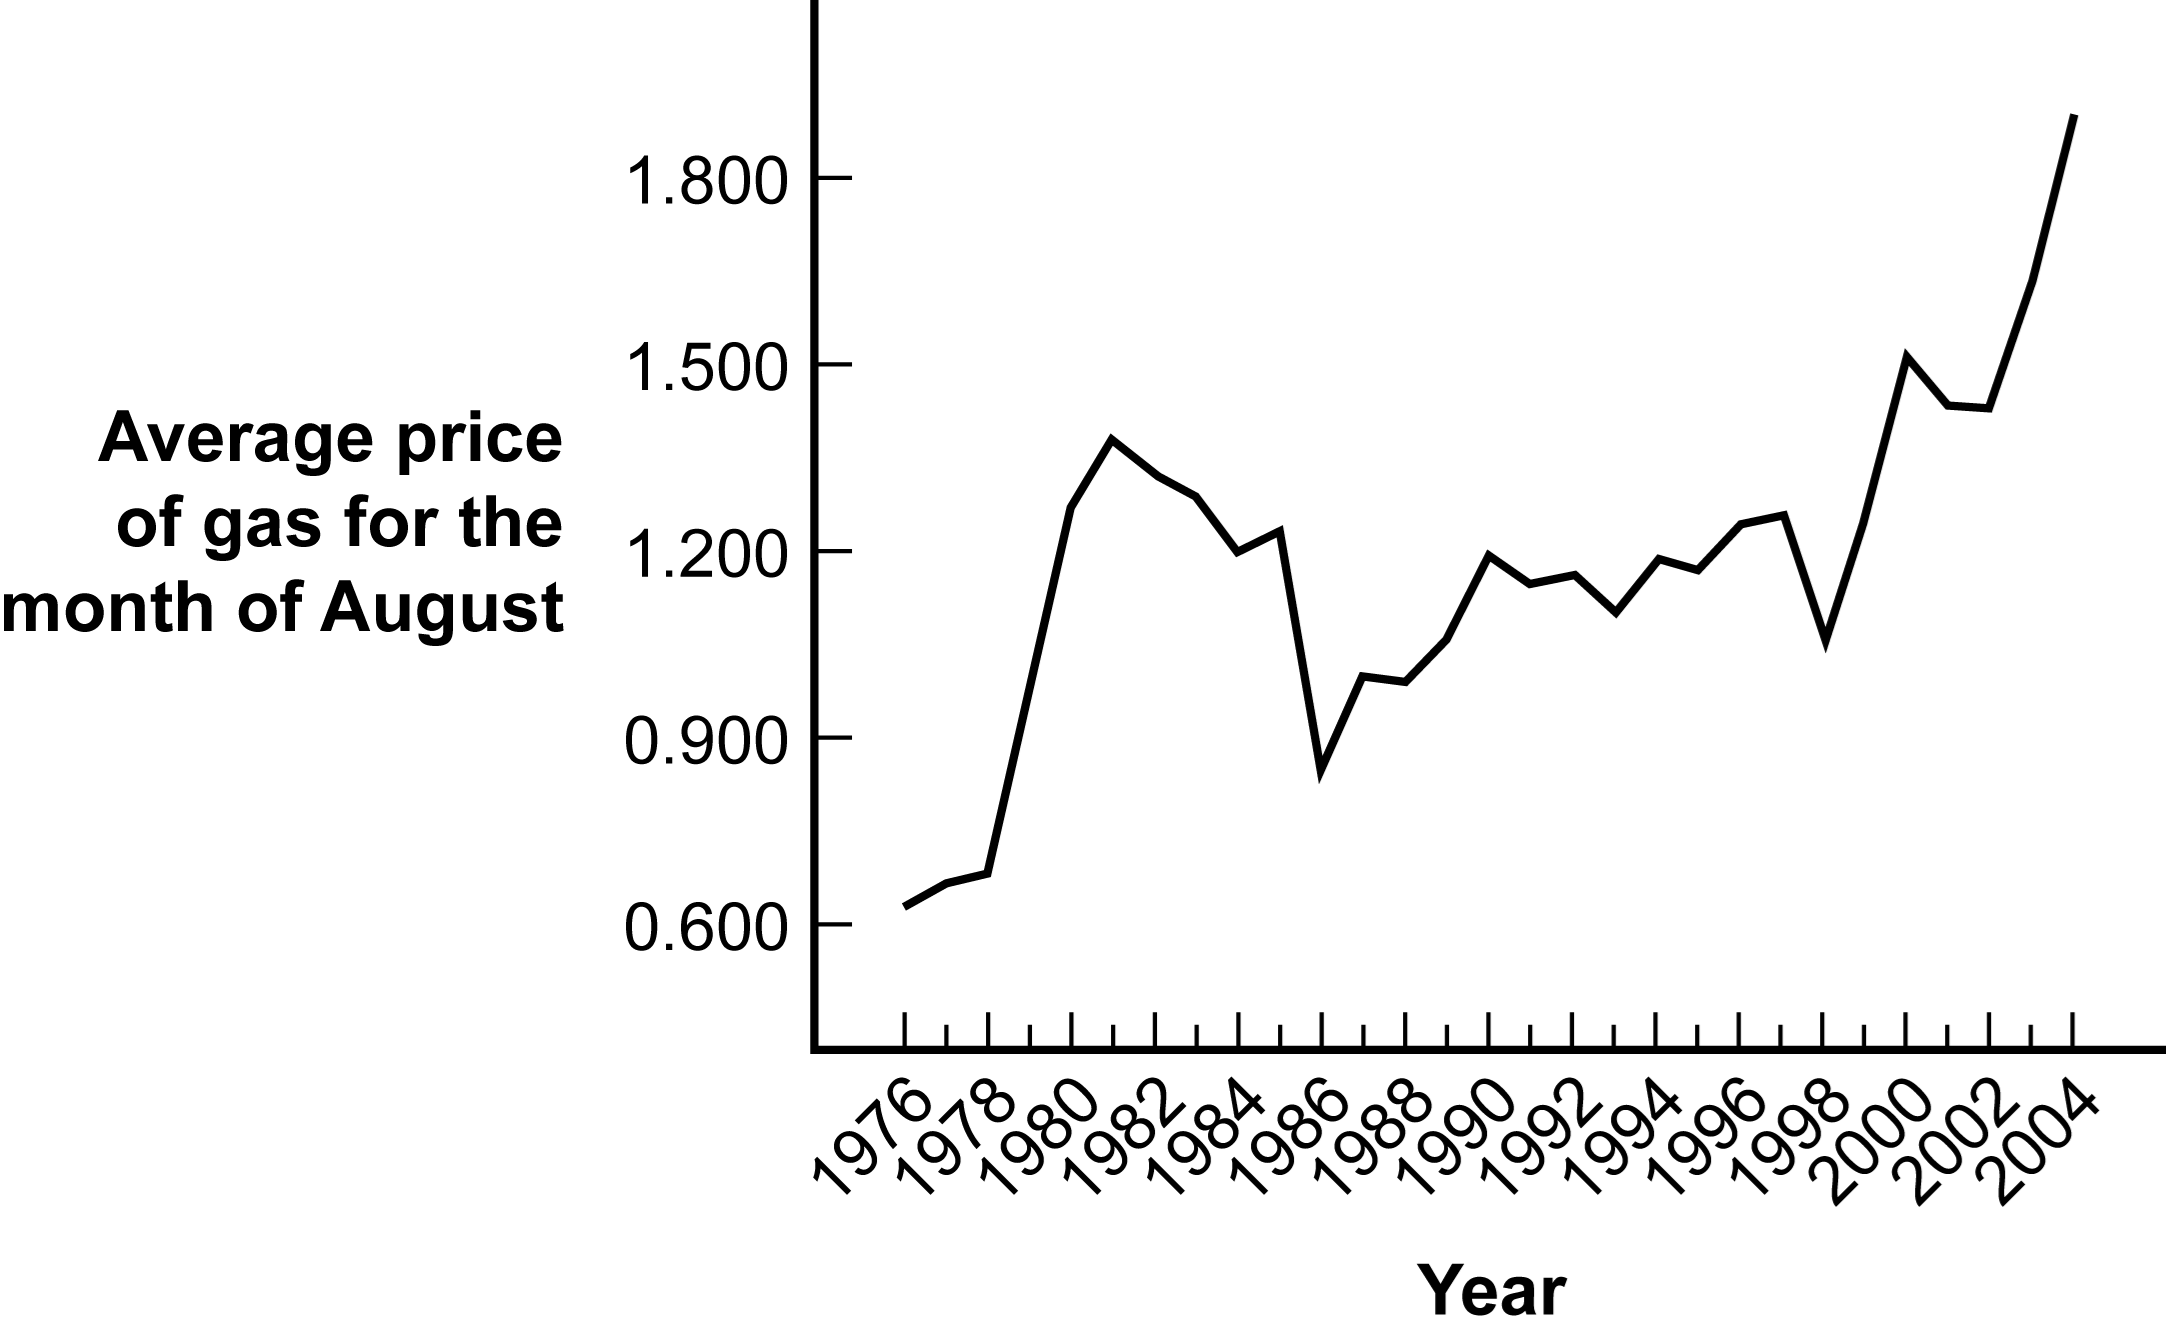
-(Figure: Gas Prices) Identify the type of graph depicted in the figure.
A) histogram
B) time series plot
C) Pareto chart
D) line graph
Correct Answer:

Verified
Correct Answer:
Verified
Q3: To graph the frequencies of one scale
Q4: When one has a scale variable based
Q5: Scatterplots visually depict the type of relation
Q6: An insurance company hires Ulrich to explain
Q7: A pictorial graph that shows fire danger
Q9: Which of these is an example of
Q10: Multivariable graphs allow for the simultaneous depiction
Q11: A group of students graphs the number
Q12: _ allow one to connect points on
Q13: Scatterplots are often used to assess what