Multiple Choice
Use the following to answer questions
This table and figure depict the average SAT scores for entering freshmen in the year 1995 at 36 North Carolina colleges.
Figure: Histogram of SAT 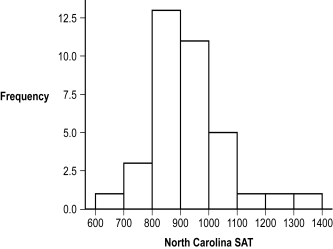
-(Figure: Histogram of SAT) What seems to be the shape of the distribution represented in this histogram?
A) symmetrical
B) positively skewed
C) rectangle
D) negatively skewed
Correct Answer:

Verified
Correct Answer:
Verified
Q6: A graduate statistics class is unhappy with
Q7: Stem-and-leaf plots offer an advantage over histograms
Q8: Floor effects can lead to positive skew
Q9: A(n) _ is often seen in negatively
Q10: Katrina observes and records the number of
Q12: Some sports have what is called a
Q13: The numbers of avalanche fatalities in Colorado
Q14: Why is it sometimes easier to use
Q15: It is advisable to use a grouped
Q16: A histogram is typically used to depict