Multiple Choice
Use the following to answer questions
This polygon represents a fictional distribution of scores.
Figure: Frequency Polygon 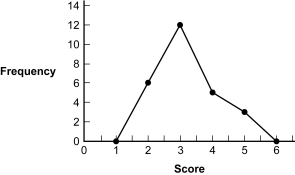
-(Figure: Frequency Polygon) Based on the distribution, how many participants scored 3?
A) 5
B) 11.5
C) 12
D) 18
Correct Answer:

Verified
Correct Answer:
Verified
Related Questions
Q71: Ceiling effects can lead to negative skew
Q72: A researcher wanted to find the tallest
Q73: The EPA noticed a large increase in
Q74: The two most common methods for graphing
Q75: Raw data are scores that have been
Q77: In a _, the tail of the
Q78: Use the following to answer questions <br>This
Q79: Ceiling effects can lead to positive skew
Q80: In a frequency polygon, the x-axis represents
Q81: For which situation is a grouped frequency