Multiple Choice
Use the following to answer questions
This polygon represents a fictional distribution of scores.
Figure: Frequency Polygon 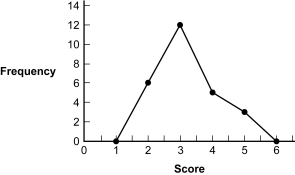
-(Figure: Frequency Polygon) What seems to be the shape of the distribution represented in this frequency polygon?
A) symmetrical
B) positively skewed
C) rectangle
D) negatively skewed
Correct Answer:

Verified
Correct Answer:
Verified
Q38: Mark is looking at a histogram depicting
Q39: Professor Kellogg calculates the grades on the
Q40: Negatively skewed distributions often result from:<br>A) a
Q41: It would be preferable to have a
Q42: A normal distribution is also known as
Q44: A benefit to using the stem-and-leaf plot
Q45: If 2 out of 3 dentists recommend
Q46: A _ is a data point that
Q47: Raw scores are data that have not
Q48: A histogram is typically used to depict