Multiple Choice
Use the following to answer questions
The scatterplot and regression line on the left depict the relation between a state's expenditure per student and the average SAT scores for students in the state.The scatterplot and regression line on the right depict the relation between students' SAT Verbal and SAT Quantitative scores.
Figure: Standard Error Comparisons 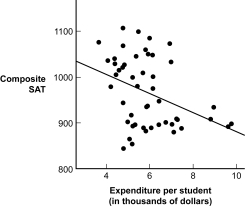
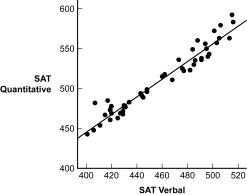
-(Figure: Standard Error Comparisons) For which prediction is the standard error of the estimate greater?
A) state expenditure per student from composite SAT scores
B) composite SAT scores from the state's expenditure per student
C) SAT Quantitative scores from SAT Verbal scores
D) SAT Verbal scores from SAT Quantitative scores
Correct Answer:

Verified
Correct Answer:
Verified
Q96: In the social sciences, there are numerous
Q97: Dr.Kim thinks his regression equation is very
Q98: In a 2008 article by Hsiu-Ling Lee,
Q99: In the equation for a line in
Q100: The standardized regression coefficient, which is equal
Q102: If two variables, independently, can help predict
Q103: The slope is the predicted value for
Q104: The simple linear regression equation uses the
Q105: Latent variables are what we can observe
Q106: What information do the slopes in a