Multiple Choice
Use the following to answer questions
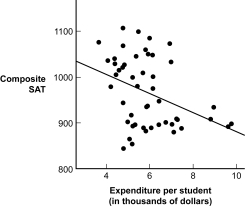
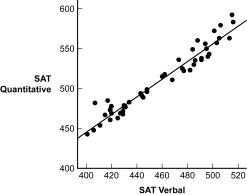
The scatterplot and regression line on the left depict the relation between a state's expenditure per student and the average SAT scores for students in the state.The scatterplot and regression line on the right depict the relation between students' SAT Verbal and SAT Quantitative scores.
Figure: Standard Error Comparisons 

-(Figure: Standard Error Comparisons) Based on the scatterplots, for which prediction is the r2 greater?
A) state expenditure per student from composite SAT scores
B) composite SAT scores from the state's expenditure per student
C) SAT Quantitative scores from SAT Verbal scores
D) SAT Verbal scores from SAT Quantitative scores
Correct Answer:

Verified
Correct Answer:
Verified
Q48: The intercept is the predicted value for
Q49: Body weight can be predicted based on
Q50: Multiple regression differs from simple linear regression
Q51: The predicted z score on the dependent
Q52: If the points on a scatterplot are
Q54: Simple linear regression allows one to:<br>A) determine
Q55: In the computer printouts presented in the
Q56: The statistic that describes the variability of
Q57: Data from 147 colleges from 1995 to
Q58: Proportionate reduction in error can be symbolized