Multiple Choice
Use the following to answer question
The scatterplot, created from 1995 U.S.News & World Report data on approximately 1,300 U.S.colleges and universities, depicts the relation between the student-faculty ratio at the school and the number of admissions applications the school received.
Figure: Student-Faculty Ratio 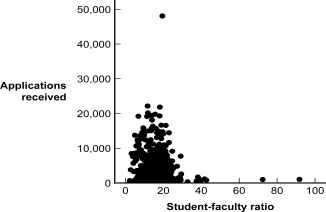
-(Figure: Student-Faculty Ratio) Based on the scatterplot, what is the relation between an institution's student-faculty ratio and the number of applications it receives?
A) perfect positive
B) positive
C) negative
D) no relation
Correct Answer:

Verified
Correct Answer:
Verified
Q100: Before starting the calculations of a correlation,
Q101: Test-retest reliability is determined by:<br>A) administering the
Q102: Which statement is an assumption that should
Q103: _ reliability measures consistency of a test
Q104: Based on research with her patients, Dr.Sabine
Q106: The numerical value for a correlation ranges
Q107: Which value represents the strongest relation between
Q108: A coefficient alpha of _ is considered
Q109: The results of a study find a
Q110: According to guidelines published by Cohen (1988),