Multiple Choice
The eight climographs show yearly temperature (line graph and left vertical axis) and precipitation (bar graph and right vertical axis) averages for each month for some locations on Earth.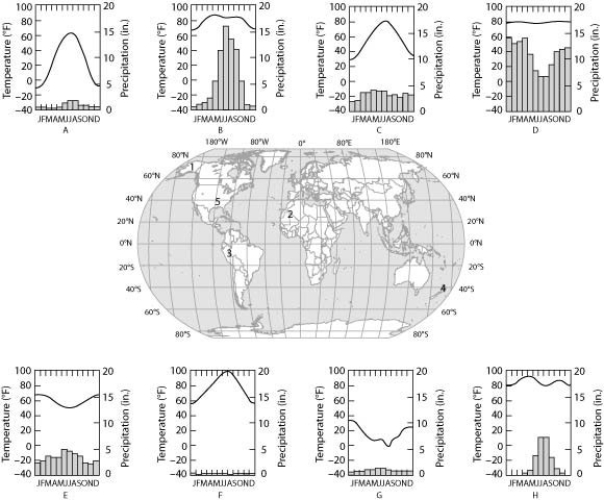
Which climograph shows the climate for location 1?
A) A
B) C
C) E
D) H
Correct Answer:

Verified
Correct Answer:
Verified
Q29: Which of the following is responsible for
Q46: Which of the following areas of study
Q53: The main reason polar regions are cooler
Q54: Which of the following examples demonstrate an
Q55: In mountainous areas of western North America,
Q57: Use the diagram showing the spread of
Q58: Generally speaking, deserts are located in places
Q61: What would happen to the seasons if
Q62: The eight climographs show yearly temperature (line
Q63: The eight climographs show yearly temperature (line