Multiple Choice
The eight climographs show yearly temperature (line graph and left vertical axis) and precipitation (bar graph and right vertical axis) averages for each month for some locations on Earth.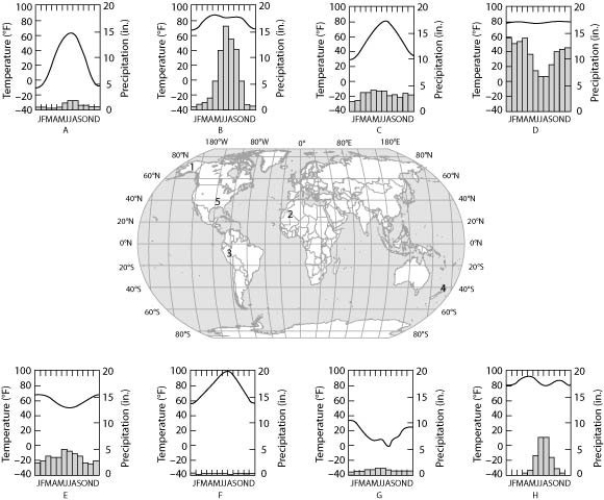
Which climograph shows the climate for location 3?
A) B
B) C
C) D
D) E
Correct Answer:

Verified
Correct Answer:
Verified
Related Questions
Q15: Two plant species live in the same
Q16: The oceans affect the biosphere in all
Q17: A certain species of pine tree survives
Q17: When climbing a mountain, we can observe
Q21: Use the following figure to answer the
Q22: Imagine that a deep temperate zone lake
Q24: Use the following figures to answer the
Q25: If global warming continues at its present
Q57: Which of the following statements best describes
Q66: When climbing a mountain, we can observe