Multiple Choice
Use the graph to answer the following question.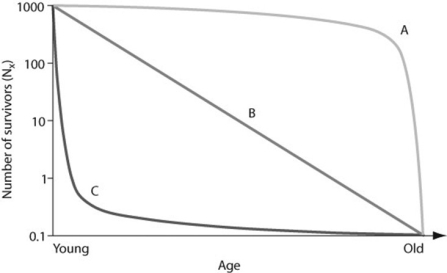
Which of the following examples are plausible explanations for a population that would produce curve A in the figure?
I.Ongoing predation of rabbits throughout their lives
II.Susceptibility of older humans to heart disease
III.High seedling mortality in sunflowers
A) I only
B) II only
C) I and II
D) II and III
Correct Answer:

Verified
Correct Answer:
Verified
Q14: A population of white-footed mice becomes severely
Q38: Uniform spacing patterns in plants such as
Q39: Which of the following statements about human
Q40: Use the table to answer the following
Q41: Long-term studies of Belding's ground squirrels show
Q42: To measure the population of lake trout
Q44: Natural selection involves energetic trade-offs between _.<br>A)
Q45: In July 2008, the United States had
Q46: Use the figure to answer the following
Q48: Use the figure to answer the following