Multiple Choice
This graph shows the feasible region (defined by points ACDEF) and objective function level curve (BG) for a maximization problem. Which point corresponds to the optimal solution to the problem? 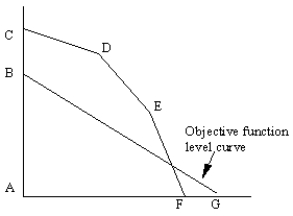
A) A
B) B
C) C
D) D
E) E
Correct Answer:

Verified
Correct Answer:
Verified
Related Questions
Q26: The symbols X<sub>1</sub>, Z<sub>1</sub>, Dog are all
Q27: The constraint for resource 1 is
Q34: Retail companies try to find<br>A) the least
Q39: Which of the following actions would expand
Q47: A mathematical programming application employed by a
Q53: Solve the following LP problem graphically
Q54: A manager has only 200 tons of
Q59: The following linear programming problem has
Q60: Bob and Dora Sweet wish to
Q64: If there is no way to simultaneously