Multiple Choice
Exhibit 12.2
The following questions use the information below.
The owner of Fix-a-dent Auto Repair wants to study the growth of his business using simulation. He is interested in simulating the number of damaged cars and the amount of damage to the cars each month. He currently repairs 100 cars per month and feels the change in number of cars can vary uniformly between a decrease of as much as 3% and an increase of up to 5% (average change of 1%) . The dollar value of the damage to the cars is a normally distributed random variable with a mean of $3,000 and a standard deviation of $500. The average repair bill has been increasing steadily over the years and the owner expects the mean repair bill will increase by 1% per month. A spreadsheet model to simulate the problem has been run 300 times. A part of the simulation statistics output from Risk Solver Platform (RSP) and a spreadsheet for computing confidence intervals follows. 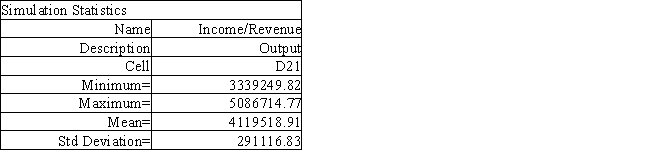

-Using the information in Exhibit 12.2, what is the worst case scenario for the Fix-a-dent company based on this output?
A) $1,747,464.94
B) $3,339,249.82
C) $4,122,024.01
D) $4,207,301.98
Correct Answer:

Verified
Correct Answer:
Verified
Q72: The worst-case analysis approach to risk analysis<br>A)
Q73: Exhibit 12.3<br>The following questions use the information
Q74: Exhibit 12.5<br>The following questions use the information
Q75: Exhibit 12.3<br>The following questions use the information
Q76: Using the information in Exhibit 12.3, what
Q78: One of Analytic Solver Platform's amazing capabilities
Q79: As the number of replicates in a
Q80: The educational version of Analytic Solver Platform
Q81: Exhibit 12.3<br>The following questions use the information
Q82: In a what-if analysis the decision maker<br>A)