Multiple Choice
Exhibit 12.2
The following questions use the information below.
The owner of Fix-a-dent Auto Repair wants to study the growth of his business using simulation. He is interested in simulating the number of damaged cars and the amount of damage to the cars each month. He currently repairs 100 cars per month and feels the change in number of cars can vary uniformly between a decrease of as much as 3% and an increase of up to 5% (average change of 1%) . The dollar value of the damage to the cars is a normally distributed random variable with a mean of $3,000 and a standard deviation of $500. The average repair bill has been increasing steadily over the years and the owner expects the mean repair bill will increase by 1% per month. A spreadsheet model to simulate the problem has been run 300 times. A part of the simulation statistics output from Risk Solver Platform (RSP) and a spreadsheet for computing confidence intervals follows. 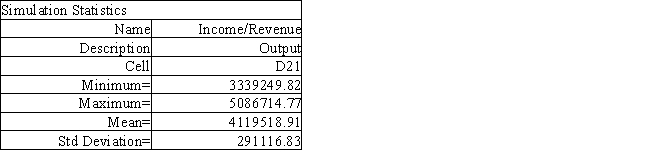
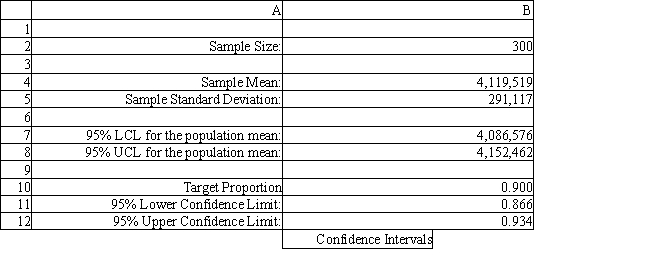
-Using the information in Exhibit 12.2, what formula should go in cell B12 of the Confidence Intervals spreadsheet to compute the upper limit on a 95% confidence interval for the population proportion below 90%?
A) =B10+1.96*B10*(1-B10) /SQRT(B2)
B) =B10+1.96*SQRT(B10*(1-B10) /B2)
C) =B10+1.96*SQRT(B10*(1-B10) *B2)
D) =B10+1.96*B10*(1-B10) /B2
Correct Answer:

Verified
Correct Answer:
Verified
Q57: What method is used to generate observations
Q58: How should one determine which RNGs to
Q59: Inventory position is defined as<br>A) ending inventory
Q60: In running simulations under Analytic Solver Platform
Q61: Common continuous distributions available in Analytic Solver
Q63: Exhibit 12.5<br>The following questions use the information
Q64: Exhibit 12.5<br>The following questions use the information
Q65: Exhibit 12.5<br>The following questions use the information
Q66: Exhibit 12.4.<br>The following questions use the information
Q67: Exhibit 12.3<br>The following questions use the information