Multiple Choice
Use the following figure to answer the question.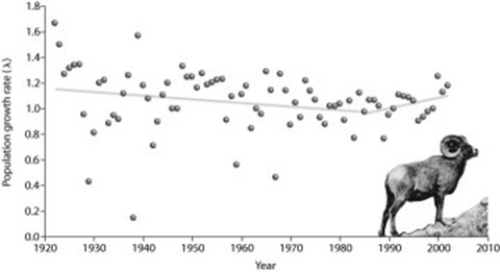
According to the figure, which two consecutive years had the largest change in the population growth rate?
A) 1967-1968
B) 1922-1923
C) 1938-1939
D) 1985-1986
Correct Answer:

Verified
Correct Answer:
Verified
Related Questions
Q8: Brown-headed cowbirds utilize fragmented forests effectively by
Q14: Which of the following terms includes all
Q46: The main goal of sustainable development is
Q48: The primary difference between the small-population approach
Q49: What strategy was used to rescue Illinois
Q50: Which of the following is a generally
Q52: Use the following figure to answer the
Q53: Establishing new nature reserves in biodiversity hot
Q54: Philippe Bouchet and colleagues conducted a massive
Q55: The main cause of the increase in