Multiple Choice
Use the following graph and information to answer the question.
Flycatcher birds that migrate from Africa to Europe feed their chicks a diet that is almost exclusively moth caterpillars. The graph shows the peak dates of flycatcher arrival in Europe, bird hatching, and peak caterpillar season for the years 1980 and 2000. The y-axis is a measure of the abundance of birds, hatching chicks, and caterpillars.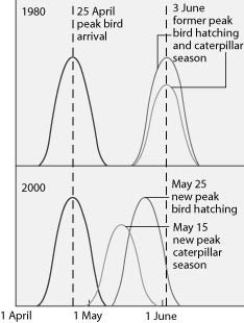
The shift in the peak of caterpillar season is most likely due to ________.
A) earlier migration returns of flycatchers
B) an innate change in the biological clock of the caterpillars
C) global warming
D) acid precipitation in Europe
Correct Answer:

Verified
Correct Answer:
Verified
Q3: Which of the following factors causes extremely
Q7: Which of the following statements regarding extinction
Q10: Which of the following is a consequence
Q11: Agricultural lands frequently require nutrient augmentation because
Q11: Your friend is wary of environmentalists' claims
Q12: Which of the following strategies would most
Q13: During the inventory of bacterial genes present
Q14: Suppose you attend a town meeting at
Q39: If all individuals in the last remaining
Q47: Eutrophication is often caused by excess limiting-nutrient