Multiple Choice
Refer to the following figure:
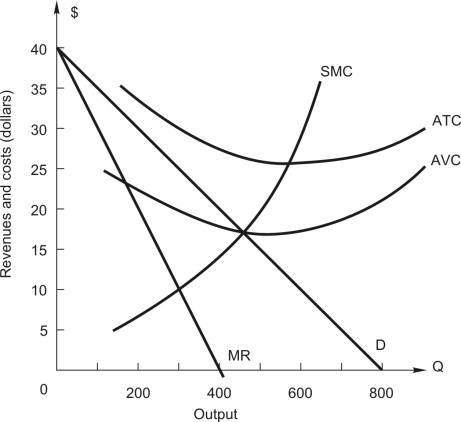
The figure above shows the demand and cost curves facing a price-setting firm.
-In profit-maximizing (or loss-minimizing) equilibrium, the Lerner index is _____, and the elasticity of demand is ______.
A) 1 ; -1
B) 0.6; -1.667
C) 0.5; -2.0
D) 0.667; -1.5
E) 1.33; -0.75
Correct Answer:

Verified
Correct Answer:
Verified
Q3: A monopolistic competitor is producing a level
Q40: A monopolist which suffers losses in the
Q50: If firms in a monopolistically competitive industry
Q65: Refer to the following figure:<br> <img src="https://d2lvgg3v3hfg70.cloudfront.net/TB2558/.jpg"
Q67: Refer to the following:<br><br>A firm with two
Q68: Refer to the following table showing
Q71: Involve a profit-maximizing monopolist. Using time-series
Q72: Refer to the following figure:<br> <img src="https://d2lvgg3v3hfg70.cloudfront.net/TB2558/.jpg"
Q75: Refer to the following:<br>The market demand
Q84: If a monopolist is producing a level