Multiple Choice
Refer to the following:
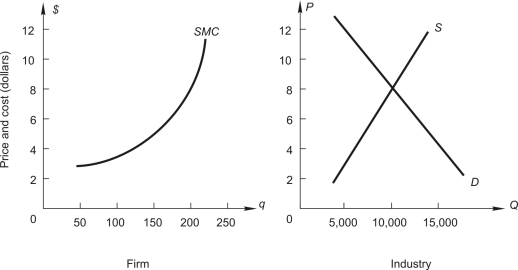
The graph on the left shows the short-run marginal cost curve for a typical firm selling in a perfectly competitive industry. The graph on the right shows current industry demand and supply.
-What output should the firm produce?
A) 200
B) 250
C) 150
D) 300
Correct Answer:

Verified
Correct Answer:
Verified
Q8: Refer to the following figure, showing the
Q9: Use the following information to answer
Q10: Refer to the following:<br> <img src="https://d2lvgg3v3hfg70.cloudfront.net/TB2558/.jpg" alt="Refer
Q12: Refer to the following figure:<br> <img src="https://d2lvgg3v3hfg70.cloudfront.net/TB2558/.jpg"
Q14: Refer to the following:<br>Consider a competitive
Q15: Refer to the following figure:<br> <img src="https://d2lvgg3v3hfg70.cloudfront.net/TB2558/.jpg"
Q16: Which of the following is NOT a
Q18: Refer to the following:<br>Consider a competitive
Q77: In a perfectly competitive market,<br>A)a firm can
Q96: Which of the following is NOT a