Multiple Choice
Refer to the following figure:
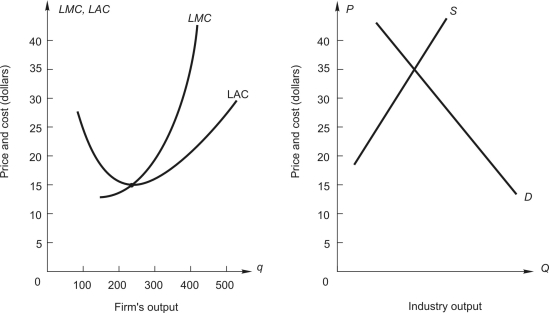
The graph on the left shows long-run average and marginal cost for a typical firm in a perfectly competitive industry. The graph on the right shows demand and long-run supply for an increasing-cost industry.
-If this were a constant-cost industry, what would be the price when the industry gets to long-run competitive equilibrium?
A) between $35 and $20
B) $35
C) $20
D) below $20
E) above $35
Correct Answer:

Verified
Correct Answer:
Verified
Q4: a perfectly competitive market<br>A)a firm must lower
Q40: Refer to the following:<br>Consider a competitive
Q41: Use the following data for
Q42: Refer to the following:<br>Consider a competitive
Q43: Use the following data for a
Q43: An industry is in long-run competitive equilibrium.The
Q44: Refer to the following:<br>Total cost schedule
Q47: Refer to the following:<br>A consulting company
Q49: Use the following information to answer
Q74: In order to minimize losses in the