Short Answer
The following graph shows one of a firm's isocost curves and isoquants. 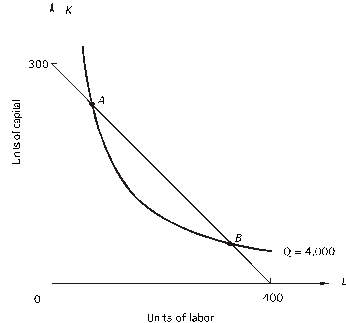
a. Combination A is not an economically efficient method of producing 4,000 units of output because, at A, _________ exceeds _________ or, in other words, _________ exceeds _________. The firm should increase ___________ and decrease ___________.
b. Combination B is not an economically efficient method of producing 4,000 units of output because, at B, _________ exceeds _________, or, in other words, _________ exceeds _________. The firm should increase ___________ and decrease ___________.
c. At the economically efficient method of producing 4,000 units of output the MRTS will equal _________.
Correct Answer:

Verified
a. MRTS; the input price ratio...View Answer
Unlock this answer now
Get Access to more Verified Answers free of charge
Correct Answer:
Verified
View Answer
Unlock this answer now
Get Access to more Verified Answers free of charge
Q81: Refer to the following:<br><br>A producer is hiring
Q82: <img src="https://d2lvgg3v3hfg70.cloudfront.net/TB2558/.jpg" alt=" -As you move
Q83: Refer to the following:<br><br>A producer is hiring
Q84: Refer to the following:<br>Following is a
Q85: The slope of an isoquant is<br>A)-
Q87: Refer to the following:<br> <img src="https://d2lvgg3v3hfg70.cloudfront.net/TB2558/.jpg" alt="Refer
Q89: Economies of scale exist when<br>A)total cost decreases
Q89: Refer to the following:<br>Following is a
Q90: If there are no fixed costs in
Q91: Refer to the following figure:<br> <img src="https://d2lvgg3v3hfg70.cloudfront.net/TB2558/.jpg"