Multiple Choice
Use the figure below, which shows a linear demand curve and the associated total revenue curve, to answer the questions. 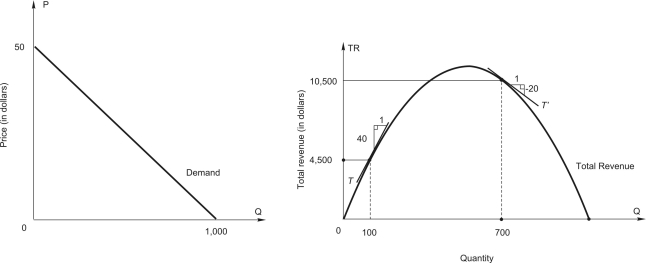
-The maximum possible total revenue is $_________.
A) 10,500
B) 11,000
C) 11,500
D) 12,000
E) 12,500
Correct Answer:

Verified
Correct Answer:
Verified
Q56: Refer to the following figure:<br> <img src="https://d2lvgg3v3hfg70.cloudfront.net/TB2558/.jpg"
Q57: Use the figure below, which shows a
Q58: If a drought increases the price of
Q59: Refer to the following table showing
Q60: Refer to the following table showing
Q62: The fact that the cross-price elasticity of
Q63: <br> <img src="https://d2lvgg3v3hfg70.cloudfront.net/TB2558/.jpg" alt="
Q64: Refer to the following figure:<br> <img src="https://d2lvgg3v3hfg70.cloudfront.net/TB2558/.jpg"
Q65: <br> <img src="https://d2lvgg3v3hfg70.cloudfront.net/TB2558/.jpg" alt="
Q66: Suppose that the Houston Rockets' management is