Multiple Choice
Use the figure to calculate the income elasticity of demand when income increases from $25,000 to $30,000: 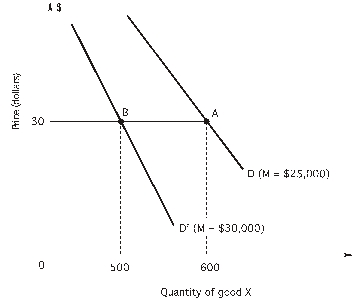
A) -1.0
B) -0.1818
C) 0.1818
D) -1.5
E) 1.2
Correct Answer:

Verified
Correct Answer:
Verified
Q28: Refer to the following figure:<br> <img src="https://d2lvgg3v3hfg70.cloudfront.net/TB2558/.jpg"
Q29: When demand is inelastic,<br>A) quantity sold does
Q30: When marginal revenue is zero,<br>A) P <
Q31: Refer to the following figure:<br> <img src="https://d2lvgg3v3hfg70.cloudfront.net/TB2558/.jpg"
Q32: Refer to the following figure:<br> <img src="https://d2lvgg3v3hfg70.cloudfront.net/TB2558/.jpg"
Q34: <br>"When the British government tripled university
Q35: <br> <img src="https://d2lvgg3v3hfg70.cloudfront.net/TB2558/.jpg" alt="
Q36: The demand for good X will be
Q37: Refer to the following graph:<br> <img src="https://d2lvgg3v3hfg70.cloudfront.net/TB2558/.jpg"
Q38: Refer to the following figure:<br> <img src="https://d2lvgg3v3hfg70.cloudfront.net/TB2558/.jpg"