Multiple Choice
Refer to the following graph:
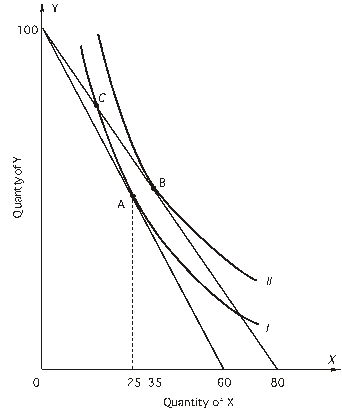
The consumer's income is $600.
-At point C,
A) MRS is greater than 1.25.
B) MRS is less than 0.4.
C) MRS is greater than 2.
D) MRS is less than 2.5.
Correct Answer:

Verified
Correct Answer:
Verified
Related Questions
Q2: Refer to the following graphs of a
Q3: In spending all his income, the consumer
Q4: Refer to the following figure:<br> <img src="https://d2lvgg3v3hfg70.cloudfront.net/TB2558/.jpg"
Q6: For the questions , assume
Q8: Refer to the following figure:<br> <img
Q9: Ms. Birnbaum is buying bottles of beer
Q10: Refer to the following graphs of a
Q11: If a consumer is choosing the bundle
Q12: Refer to the following graph:<br>The price of
Q34: utility function<br>A)shows the relation between prices and