Multiple Choice
Refer to the following graph:
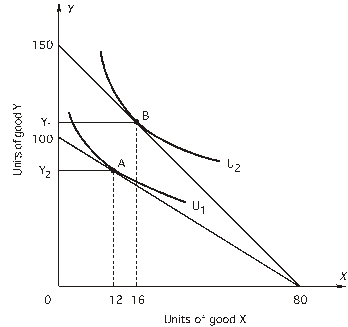
The consumer's income is $1,200.
-What is Y1?
A) 30
B) 80
C) 110
D) 120
E) none of the above
Correct Answer:

Verified
Correct Answer:
Verified
Q7: Which of the following is NOT a
Q16: Refer to the following indifference map for
Q17: For questions assume that an
Q18: The slope of an indifference curve shows<br>A)
Q19: <br> <img src="https://d2lvgg3v3hfg70.cloudfront.net/TB2558/.jpg" alt="
Q20: Refer to the following graph:<br> <img src="https://d2lvgg3v3hfg70.cloudfront.net/TB2558/.jpg"
Q22: Refer to the following graphs:<br><img src="https://d2lvgg3v3hfg70.cloudfront.net/TB2558/.jpg"
Q23: Refer to the following graphs:<br><img src="https://d2lvgg3v3hfg70.cloudfront.net/TB2558/.jpg" alt="Refer
Q24: <br> <img src="https://d2lvgg3v3hfg70.cloudfront.net/TB2558/.jpg" alt="
Q25: Refer to the following graph:<br> <img src="https://d2lvgg3v3hfg70.cloudfront.net/TB2558/.jpg"