Multiple Choice
Refer to the following graphs: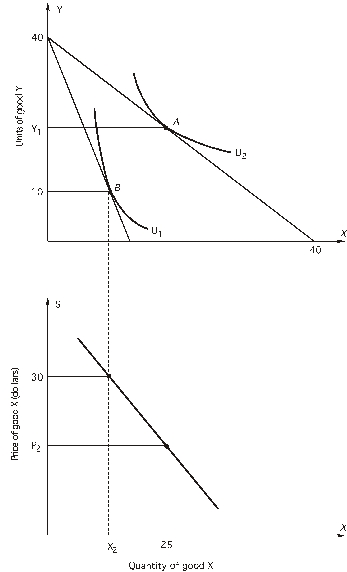
The price of Y is $15 per unit.
-What does the curve in the lower graph show?
A) how a consumer's utility-maximizing choices of X and Y change when the budget constraint changes
B) how a consumer's preferences change when income changes
C) how a consumer's utility-maximizing choices of X changes when the price of X changes
D) how a consumer's utility-maximizing choices of Y changes when the price of Y changes
E) both c and d
Correct Answer:

Verified
Correct Answer:
Verified
Q5: Suppose that utility-maximizing consumers in San Francisco
Q37: An individual's demand curve for X<br>A) shows
Q38: According to the Rolling Stones, "You can't
Q39: Alexandra consumes only caviar and champagne, but
Q40: Refer to the following graph:<br> <img src="https://d2lvgg3v3hfg70.cloudfront.net/TB2558/.jpg"
Q41: Refer to the following graphs:<br><img src="https://d2lvgg3v3hfg70.cloudfront.net/TB2558/.jpg"
Q43: Suppose a consumer who purchases only two
Q44: Marginal utility is<br>A) the utility obtained from
Q45: Refer to the following:<br> <img src="https://d2lvgg3v3hfg70.cloudfront.net/TB2558/.jpg" alt="Refer
Q46: The rate at which a consumer is