Multiple Choice
Refer to the following figure, which shows marginal benefits (MB) and marginal cost (MC) of activity A.
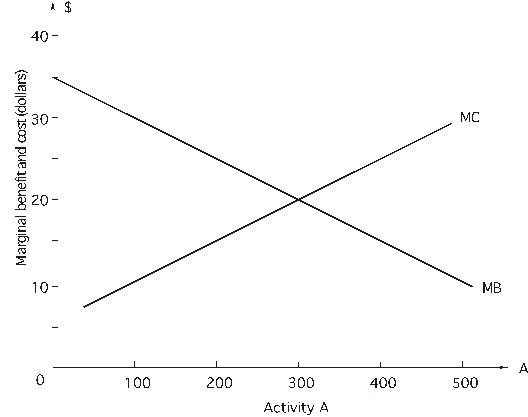
-If the decision maker is choosing 400 units of activity A,
A) this level maximizes net benefits.
B) the activity could be reduced by one unit and net benefits will increase by $10.
C) the activity could be reduced by one unit and net benefits will rise by $25.
D) the activity could be increased by one unit and net benefits will increase by $15.
E) the activity could be reduced by one unit and net benefits would decrease by $10.
Correct Answer:

Verified
Correct Answer:
Verified
Q34: Which of the following statements represents bad
Q36: <br>A politician, who wants to
Q37: <br>A toy manufacturer is experiencing
Q39: A package delivery service uses vans and
Q40: The optimal level of pollution reduction is
Q41: Fill in the blanks in the
Q42: <br>A student taking economics, statistics,
Q43: <br>Dr. X, an assistant professor
Q89: function a decision maker seeks to maximize
Q97: <br> <span class="ql-formula" data-value="\begin{array}{cccccc}\text