Multiple Choice
The graph shows the sales (in billions of dollars) for Apple Inc.for the years 2001 through 2007. 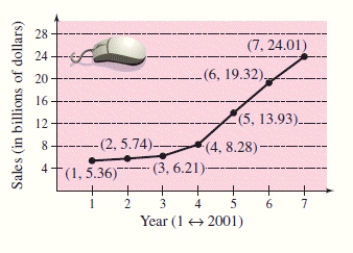 Find the slope of the line segment connecting the points for the years 2003 and 2004.Round the answer to two decimal places.
A) -5.07
B) 2.07
C) 7.07
D) 3.07
E) -2.07
Correct Answer:

Verified
Correct Answer:
Verified
Related Questions
Q27: Evaluate the function f(x)= 3[[3x - 1]]
Q428: The length and width of a
Q429: Find ( f - g
Q430: An object is dropped from a height
Q432: Find the zeros of the
Q434: Find (f - g)(x).
Q435: Evaluate q(4) if <span class="ql-formula"
Q436: Select the correct graph of the
Q437: Use the intercept form to find
Q438: Select the correct graph, showing f