Multiple Choice
Graphically estimate the x- and y-intercepts of the graph.
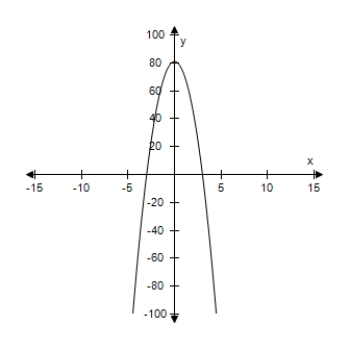
A) x-intercept: (±3, 0) y-intercept: (0, 81)
B) x-intercept: (3, 0) y-intercept: (0, 81)
C) x-intercept: (-3, 0) y-intercept: (0, 81)
D) x-intercept: (±3, 0) y-intercept: (0, 9)
E) x-intercept: (0, 3) y-intercept: (0, 81)
Correct Answer:

Verified
Correct Answer:
Verified
Q66: Let S represent the midpoint between (5,3)and
Q285: Find the average rate of change
Q286: Which function does the graph represent<br><img src="https://d2lvgg3v3hfg70.cloudfront.net/TB7698/.jpg"
Q287: Select the correct graph, showing f
Q289: Select the graph of the function
Q291: Find (f - g)(x).
Q292: Use the graph of <span
Q293: Use the given graph of f
Q294: A real estate office handles an
Q295: For following function, select (on the