Multiple Choice
Use the graph, which shows the average retail prices of 1 gallon of whole milk from 1996 through 2007. 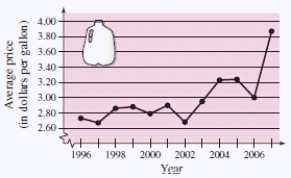
Approximate the percent change in the price of milk from the price in 2000 to the highest price shown in the graph.
A) About 48%
B) About 58%
C) About 43%
D) About 53%
E) About 38%
Correct Answer:

Verified
Correct Answer:
Verified
Related Questions
Q9: Find all real values of x such
Q322: Identify the following function.
Q323: Find the coordinates of the point C
Q324: Use the graph of the
Q326: The simple interest on an investment
Q328: Find the center and radius of
Q329: Use the graph of <span
Q330: Select the graph of the given function
Q331: Find the slope and y-intercept (if
Q332: Determine whether the function has an