Multiple Choice
Select a scatter plot of the given data.
A) 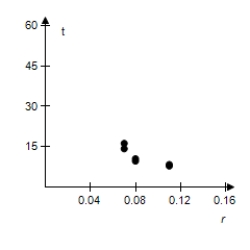
B) 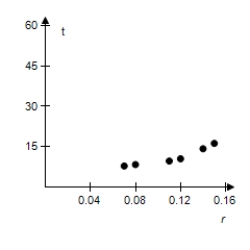
C) 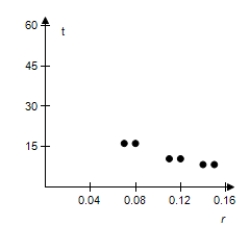
D) 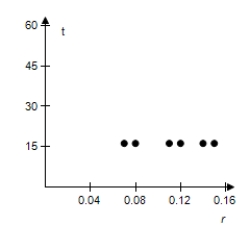
E) 
Correct Answer:

Verified
Correct Answer:
Verified
Related Questions
Q128: Solve the equation <span class="ql-formula"
Q129: The chemical acidity of a solution
Q130: Write the exponential equation in logarithmic
Q131: Use the One-to-One Property to solve
Q132: Select the graph of the exponential
Q134: Use the change-of-base formula to rewrite
Q135: Rewrite the logarithm as a ratio
Q136: Write the logarithmic equation in exponential
Q137: Rewrite the logarithm as a ratio
Q138: Solve the logarithmic equation algebraically.Approximate the