Multiple Choice
There were approximately 28 million unemployed workers in the United States.The circle graph shows the age profile of these unemployed workers.What is the probability that a person selected at random from the population of unemployed workers is in the 45-64 age group.( and ) 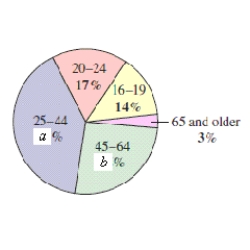
A)
B)
C)
D) 38
E)
Correct Answer:

Verified
Correct Answer:
Verified
Q26: Determine whether the sequence is arithmetic.If so,find
Q62: Find the eighth term of the geometric
Q270: Find the indicated term of the
Q271: Find the rational number representation of
Q273: Find the sum using the formulas
Q274: Find the sum of the infinite
Q276: Find the probability for the experiment
Q278: Evaluate <span class="ql-formula" data-value="{ }
Q279: The educational attainment of a country population
Q280: Select the first five terms of