Multiple Choice
TABLE 2-15
The figure below is the ogive for the amount of fat (in grams) for a sample of 36 pizzas products where the upper boundaries of the intervals are: 5, 10, 15, 20, 25, and 30.
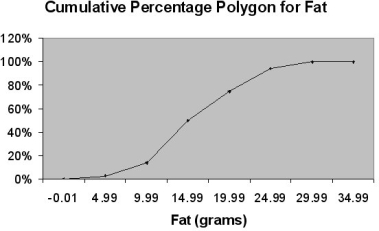
-Referring to Table 2-15, what percentage of pizza products contains between 10 and 25 grams of fat?
A) 62%
B) 81%
C) 44%
D) 14%
Correct Answer:

Verified
Correct Answer:
Verified
Q2: To determine the width of class interval,
Q61: TABLE 2-17<br>The following table presents total retail
Q69: TABLE 2-7<br>The Stem-and-Leaf display below contains data
Q77: TABLE 2-11<br>The ordered array below resulted from
Q88: TABLE 2-14<br>The table below contains the number
Q101: TABLE 2-6<br>A sample of 200 students
Q104: <span class="ql-formula" data-value="\text { TABLE 2-4 }"><span
Q122: TABLE 2-12<br>The table below contains the opinions
Q129: TABLE 2-12<br>The table below contains the opinions
Q204: TABLE 2-8<br>The Stem-and-Leaf display represents the number