Multiple Choice
TABLE 2-16
The figure below is the percentage polygon for the amount of calories for a sample of 36 pizzas products where the upper limits of the intervals are: 310, 340, 370, 400 and 430.
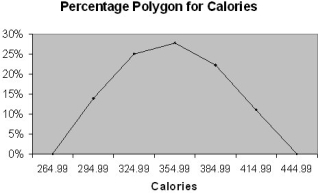
-Referring to Table 2-16, roughly what percentage of pizza products contains between 400 and 430 calories?
A) 89%
B) 100%
C) 0%
D) 11%
Correct Answer:

Verified
Correct Answer:
Verified
Q31: If the values of the seventh and
Q32: TABLE 2- 5<br>The following are the
Q36: TABLE 2-6<br>A sample of 200 students
Q38: TABLE 2-7<br>The Stem-and-Leaf display below contains data
Q38: TABLE 2- 5<br>The following are the
Q43: TABLE 2-9<br>The frequency distribution below represents the
Q83: TABLE 2-8<br>The Stem-and-Leaf display represents the number
Q91: TABLE 2-10<br>The histogram below represents scores achieved
Q103: Apple Computer, Inc. collected information on the
Q163: TABLE 2-9<br>The frequency distribution below represents the