Multiple Choice
A professor of economics at a small Texas university wanted to determine what year in school students were taking his tough economics course. Shown below is a pie chart of the results. What percentage of the class took the course prior to reaching their senior year? 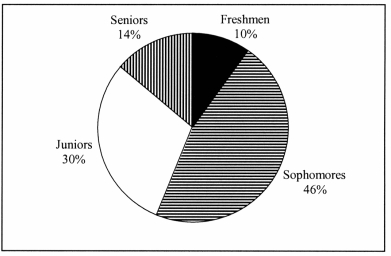
A) 86%
B) 14%
C) 54%
D) 44%
Correct Answer:

Verified
Correct Answer:
Verified
Q17: TABLE 2-14<br>The table below contains the number
Q33: In general,a frequency distribution should have at
Q55: MULTIPLE CHOICE. Choose the one alternative
Q57: When constructing charts, the following is plotted
Q60: Apple Computer, Inc. collected information on the
Q62: The width of each bar in a
Q63: A type of vertical bar chart in
Q171: TABLE 2-12<br>The table below contains the opinions
Q175: TABLE 2-8<br>The Stem-and-Leaf display represents the number
Q176: TABLE 2-17<br>The following table presents total retail