Multiple Choice
TABLE 2- 3
Every spring semester, the School of Business coordinates a luncheon with local business leaders for graduating seniors, their families, and their friends. Corporate sponsorship pays for the lunches of each of the seniors, but students have to purchase tickets to cover the cost of lunches served to guests they bring with them. The following histogram represents the attendance at the senior luncheon, where X is the number of guests each student invited to the luncheon and f is the number of students in each category.
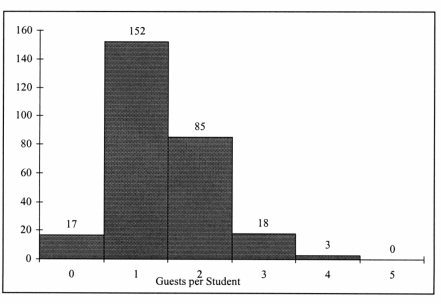
-Referring to the histogram from Table 2-3, if all the tickets purchased were used, how many guests attended the luncheon?
A) 275
B) 388
C) 4
D) 152
Correct Answer:

Verified
Correct Answer:
Verified
Q47: The point halfway between the boundaries of
Q71: TABLE 2-11<br>The ordered array below resulted from
Q98: A polygon can be constructed from a
Q101: The sum of relative frequencies in a
Q135: TABLE 2- 5<br>The following are the
Q136: <span class="ql-formula" data-value="\text { TABLE 2-14 }"><span
Q137: TABLE 2- 5<br>The following are the
Q141: TABLE 2-14<br>The table below contains the
Q164: Ogives are plotted at the midpoints of
Q198: TABLE 2-12<br>The table below contains the opinions