Multiple Choice
TABLE 2- 3
Every spring semester, the School of Business coordinates a luncheon with local business leaders for graduating seniors, their families, and their friends. Corporate sponsorship pays for the lunches of each of the seniors, but students have to purchase tickets to cover the cost of lunches served to guests they bring with them. The following histogram represents the attendance at the senior luncheon, where X is the number of guests each student invited to the luncheon and f is the number of students in each category.
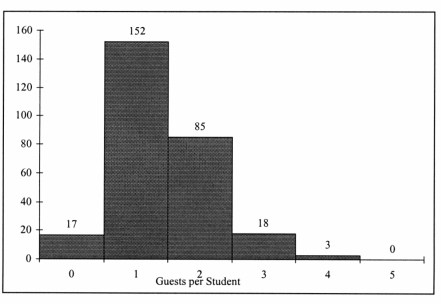
-Referring to the histogram from Table 2- 3, how many graduating seniors attended the luncheon?
A) 388
B) 4
C) 275
D) 152
Correct Answer:

Verified
Correct Answer:
Verified
Q10: TABLE 2-7<br>The Stem-and-Leaf display below contains data
Q68: TABLE 2-7<br>The Stem-and-Leaf display below contains data
Q97: TABLE 2-13<br>Given below is the stem-and-leaf display
Q140: TABLE 2-14<br>The table below contains the number
Q140: The sum of cumulative frequencies in a
Q149: TABLE 2-8<br>The Stem-and-Leaf display represents the number
Q173: TABLE 2-4<br>A survey was conducted to
Q174: TABLE 2- 5<br>The following are the
Q179: Research on Human perception concludes that the
Q181: Data on the number of credit hours