Multiple Choice
TABLE 15- 8
The superintendent of a school district wanted to predict the percentage of students passing a sixth- grade proficiency test. She obtained the data on percentage of students passing the proficiency test (% Passing) , daily average of the percentage of students attending class (% Attendance) , average teacher salary in dollars (Salaries) , and instructional spending per pupil in dollars (Spending) of 47 schools in the state.
Let Y = % Passing as the dependent variable, X1 = % Attendance, X2 = Salaries and X3 = Spending.
The coefficient of multiple determination (R 2 j) of each of the 3 predictors with all the other remaining predictors are,respectively, 0.0338, 0.4669, and 0.4743.
The output from the best- subset regressions is given below:
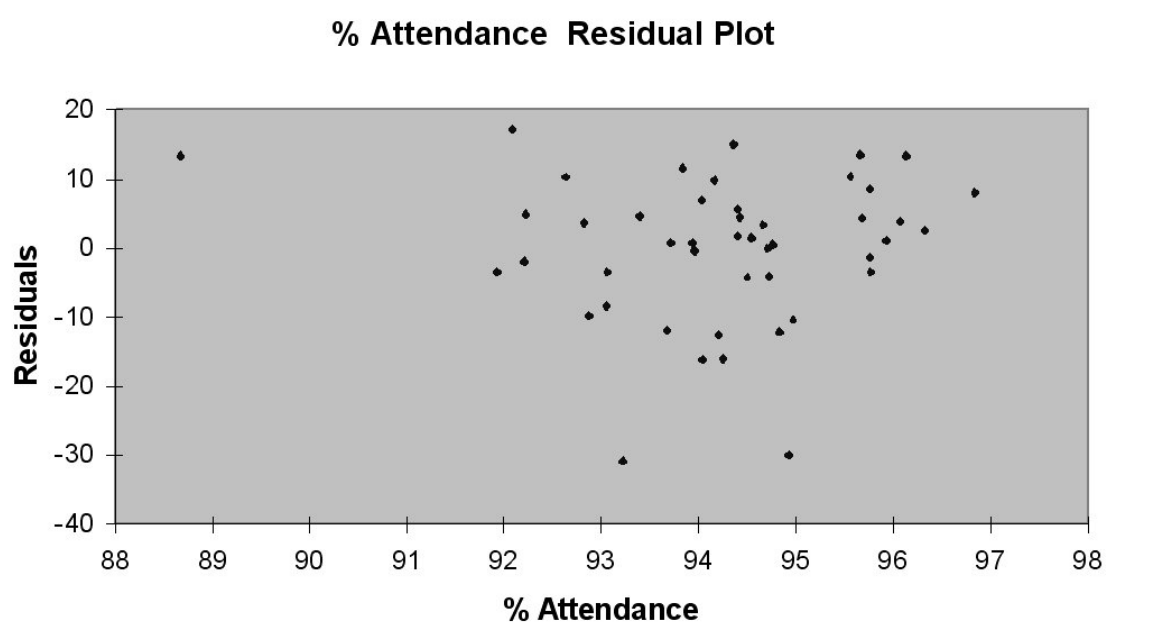
Following is the residual plot for % Attendance:
Following is the output of several multiple regression models:
-Referring to Table 15-8, the "best" model using a 5% level of significance among those chosen by the Cp statistic is
A) X1, X2, X3.
B) X1, X3.
C) either of the above
D) none of the above
Correct Answer:

Verified
Correct Answer:
Verified
Q16: Collinearity is present when there is a
Q76: The Variance Inflationary Factor (VIF) measures the<br>A)
Q77: Using the Cook's distance statistic Di to
Q78: Two simple regression models were used to
Q80: TABLE 15-9<br>Many factors determine the attendance
Q82: TABLE 15-3<br>A certain type of rare
Q83: Which of the following is used to
Q84: TABLE 15-1<br>To explain personal consumption (CONS)
Q85: TABLE 15-7<br>A chemist employed by a
Q86: Which of the following will not change